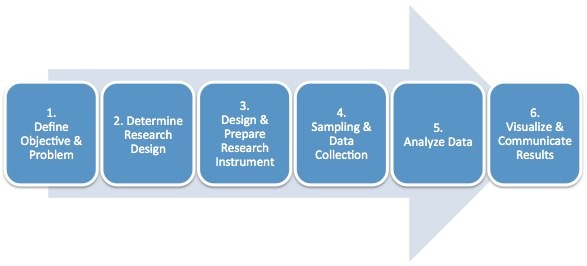
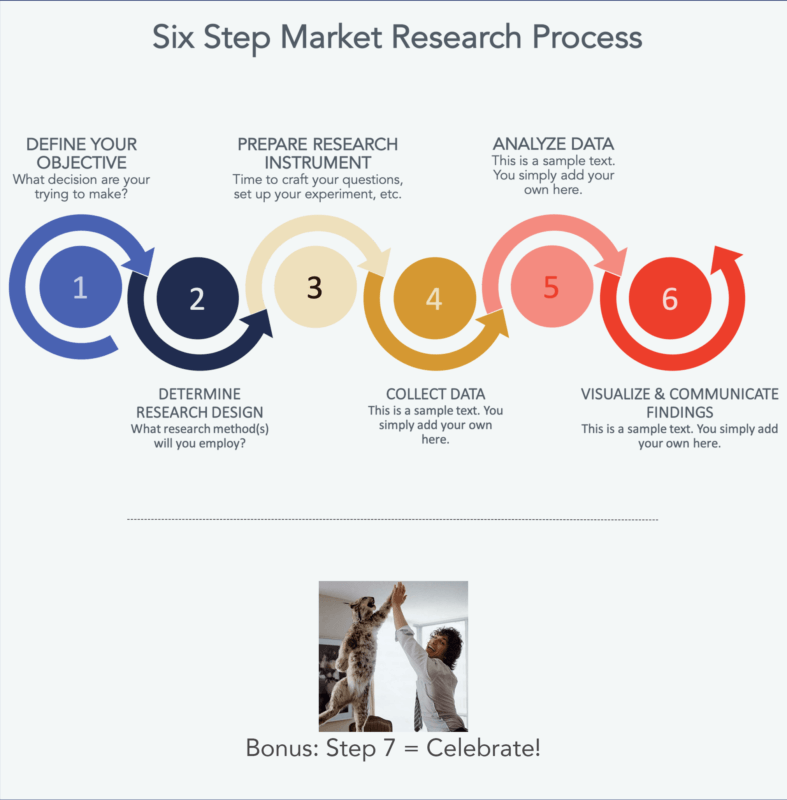
The market research process is a systematic methodology for informing business decisions. The figure below breaks the process down into six steps:

Step 1. Define the Objective & Your “Problem”
Perhaps the most important step in the market research process is defining the goals of the project. At the core of this is understanding the root question that needs to be informed by market research. There is typically a key business problem (or opportunity) that needs to be acted upon, but there is a lack of information to make that decision comfortably; the job of a market researcher is to inform that decision with solid data. Examples of “business problems” might be “How should we price this new widget?” or “Which features should we prioritize?”
By understanding the business problem clearly, you’ll be able to keep your research focused and effective. At this point in the process, well before any research has been conducted, I like to imagine what a “perfect” final research report would look like to help answer the business question(s). You might even go as far as to mock up a fake report, with hypothetical data, and ask your audience: “If I produce a report that looks something like this, will you have the information you need to make an informed choice?” If the answer is yes, now you just need to get the real data. If the answer is no, keep working with your client/audience until the objective is clear, and be happy about the disappointment you’ve prevented and the time you’ve saved.
Step 2. Determine Your “Research Design”
Now that you know your research object, it is time to plan out the type of research that will best obtain the necessary data. Think of the “research design” as your detailed plan of attack. In this step you will first determine your market research method (will it be a survey, focus group, etc.?). You will also think through specifics about how you will identify and choose your sample (who are we going after? where will we find them? how will we incentivize them?, etc.). This is also the time to plan where you will conduct your research (telephone, in-person, mail, internet, etc.). Once again, remember to keep the end goal in mind–what will your final report look like? Based on that, you’ll be able to identify the types of data analysis you’ll be conducting (simple summaries, advanced regression analysis, etc.), which dictates the structure of questions you’ll be asking.
Your choice of research instrument will be based on the nature of the data you are trying to collect. There are three classifications to consider:
Exploratory Research – This form of research is used when the topic is not well defined or understood, your hypothesis is not well defined, and your knowledge of a topic is vague. Exploratory research will help you gain broad insights, narrow your focus, and learn the basics necessary to go deeper. Common exploratory market research techniques include secondary research, focus groups and interviews. Exploratory research is a qualitative form of research.
Descriptive Research – If your research objective calls for more detailed data on a specific topic, you’ll be conducting quantitative descriptive research. The goal of this form of market research is to measure specific topics of interest, usually in a quantitative way. Surveys are the most common research instrument for descriptive research.
Causal Research – The most specific type of research is causal research, which usually comes in the form of a field test or experiment. In this case, you are trying to determine a causal relationship between variables. For example, does the music I play in my restaurant increase dessert sales (i.e. is there a causal relationship between music and sales?).
Step 3. Design & Prepare Your “Research Instrument”
In this step of the market research process, it’s time to design your research tool. If a survey is the most appropriate tool (as determined in step 2), you’ll begin by writing your questions and designing your questionnaire. If a focus group is your instrument of choice, you’ll start preparing questions and materials for the moderator. You get the idea. This is the part of the process where you start executing your plan.
By the way, step 3.5 should be to test your survey instrument with a small group prior to broad deployment. Take your sample data and get it into a spreadsheet; are there any issues with the data structure? This will allow you to catch potential problems early, and there are always problems.
Step 4. Collect Your Data
This is the meat and potatoes of your project; the time when you are administering your survey, running your focus groups, conducting your interviews, implementing your field test, etc. The answers, choices, and observations are all being collected and recorded, usually in spreadsheet form. Each nugget of information is precious and will be part of the masterful conclusions you will soon draw.
Step 5. Analyze Your Data
Step 4 (data collection) has drawn to a close and you have heaps of raw data sitting in your lap. If it’s on scraps of paper, you’ll probably need to get it in spreadsheet form for further analysis. If it’s already in spreadsheet form, it’s time to make sure you’ve got it structured properly. Once that’s all done, the fun begins. Run summaries with the tools provided in your software package (typically Excel, SPSS, Minitab, etc.), build tables and graphs, segment your results by groups that make sense (i.e. age, gender, etc.), and look for the major trends in your data. Start to formulate the story you will tell.
Step 6. Visualize Your Data and Communicate Results
You’ve spent hours pouring through your raw data, building useful summary tables, charts and graphs. Now is the time to compile the most meaningful take-aways into a digestible report or presentation. A great way to present the data is to start with the research objectives and business problem that were identified in step 1. Restate those business questions, and then present your recommendations based on the data, to address those issues.
When it comes time to presenting your results, remember to present insights, answers and recommendations, not just charts and tables. If you put a chart in the report, ask yourself “what does this mean and what are the implications?” Adding this additional critical thinking to your final report will make your research more actionable and meaningful and will set you apart from other researchers.
While it is important to “answer the original question,” remember that market research is one input to a business decision (usually a strong input), but not the only factor.
Here’s an Example
So, that’s the market research process. The figure below walks through an example of this process in action, starting with a business problem of “how should we price this new widget?”
Quiz Time
Ok, if you think you understand this stuff here’s a brief quiz:
